NST Network Interface Bandwidth Monitor
Overview
![]() The original NST Network Interface Bandwidth Monitor is deprecated and is replaced by the second generation NST Network Interface Bandwidth Monitor 2 implementation.
The original NST Network Interface Bandwidth Monitor is deprecated and is replaced by the second generation NST Network Interface Bandwidth Monitor 2 implementation.
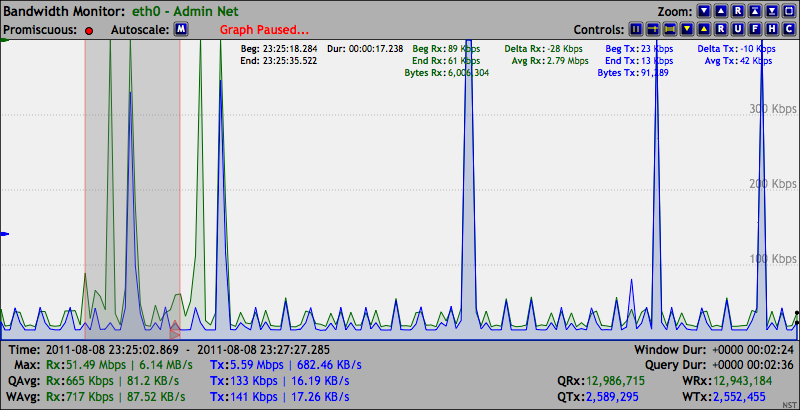
The NST Network Interface Bandwidth Monitor is an interactive dynamic SVG/AJAX enabled application integrated into the NST WUI for monitoring Network Bandwidth usage on each configured network interface in pseudo real-time. The image below is an example display of the bandwidth monitoring application for network interface: "eth0". Also shown is an included Ruler Measurement tool overlay to perform time and bandwidth rate analysis.
A use case for the Bandwidth Monitor can be found in the Wiki article: "LAN Ethernet Maximum Rates, Generation, Capturing & Monitoring".

SVN: 2502
Screencasts
The following screencast provides a brief introduction to using the Network Interface Bandwidth Monitor:
Feature Summary
The following are key features of the NST Network Interface Bandwidth Monitor tool:
- Graphically monitor Network Bandwidth rates on each configured network interface within the NST WUI.
- User selectable network interface network interface to monitor.
- Interactive display using dynamic SVG (Scalable Vector Graphics).
- User selectable AJAX query updates providing a pseudo real-time Bandwidth Rate presentation.
- Automatic and manual bandwidth rate scale adjustments.
- Pause individual graphs for analysis or synchronize both Received/Transmit graphs when using a TAP for monitoring.
- Adjustable graph dimensions for long duration bandwidth monitoring.
- Customize network interface graph titles.
- Graph controls for visual appearance including fill and opacity setting.
- Zoom controls for graph size enlargement and Full Screen viewing.
- Crosshairs overlay for exploring time and bandwidth values.
- A Ruler Measurement tool overlay for time and bandwidth rate analysis.
- A Ruler Measurement tool Peak and Trough Detection feature with Left and Right Guide movement controls.
- A Ruler Tracking Control - Allows one Bandwidth Monitor Ruler position to be applied to one or all other ruler tools.
- A Threshold Pause Configuration & Control feature that allows pausing one or more monitors when an armed rate value is reached or exceeded for defined time period.
- Ability to execute scripts based upon Threshold Pause State Notifications.
NST Bandwidth Monitor Reference Diagrams

SVN: 4089
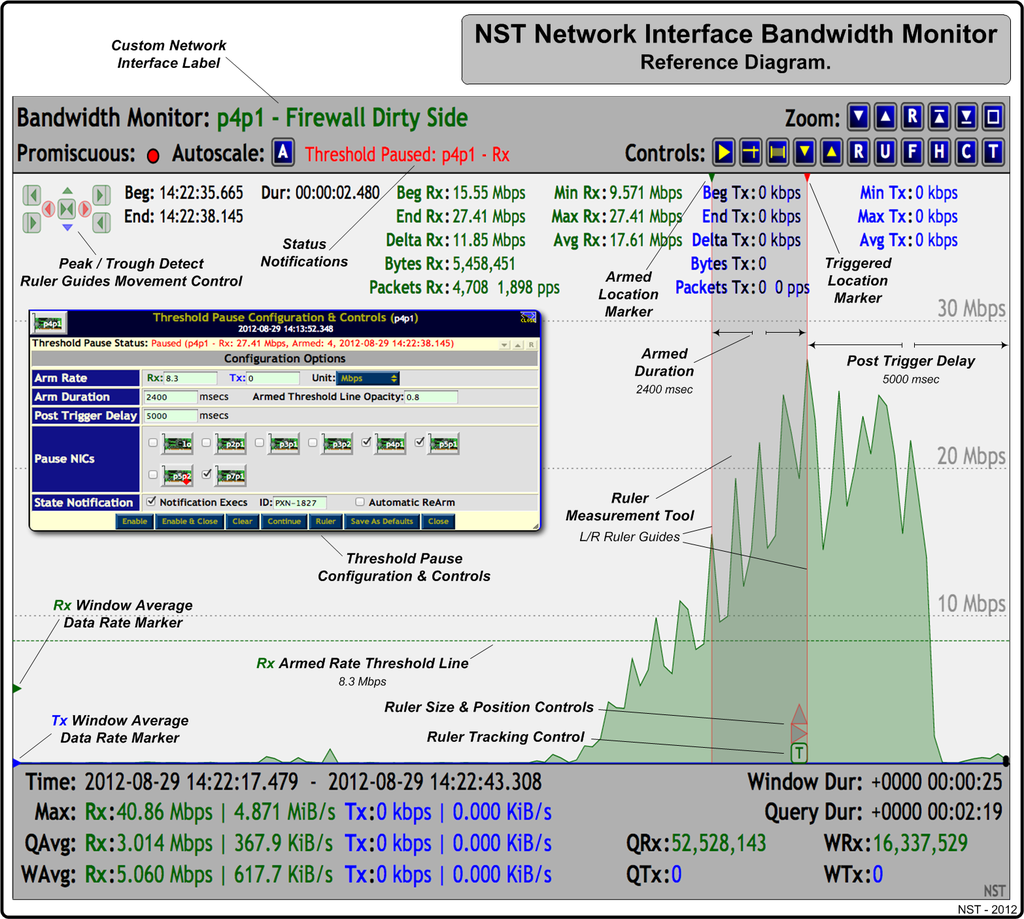
Use this section as a reference for location and description of all controls available with the NST Network Interface Bandwidth Monitors. The image below can serve as a general reference diagram for a single Bandwidth Monitor. Many of the Bandwidth Monitor features have been identified and marked on the image. A Threshold Pause feature that allows "Pausing" of one or more Bandwidth Monitoring graphs when a configured Threshold Armed Rate value is Reached or Exceeded (i.e., Triggered) is also shown. Custom executables can also be run each time a Threshold Pause state change occurs. As an example, one could initiate a network packet capture when a sustained bandwidth data rate exceeds a certain level.
The reference diagram below depicts a Threshold Pause session that was configured on the "p4p1 Bandwidth Monitoring" graph with an Armed Rx bandwidth data rate of: "8.3 Mbps". This bandwidth rate was maintained for the Armed duration of "2400 msecs" as a condition for the Threshold Trigger to occur. A Threshold Trigger event did occur on 2012-08-29 14:22:38.145 at an Rx data rate value of: "27.41 Mbps". A Post Trigger Delay of "5 seconds" was in effect. Three (3) bandwidth monitoring graphs were set to be Paused: p4p1, p5p1 and p7p1. A query rate of "200 msec" was also configured for bandwidth monitor graph updates.
All notification executables located in directory: "/etc/nst/notifications/bwmon" were run at each Threshold Pause state change and marked with ID: "PXN-1827".
The traffic generated for this example was from a YUM update. A Dualcomm DGCS-2005L TAP was used on the external side of a firewall and presented the network traffic to interface: "p4p1".
NST Bandwidth Monitor Zoom & Control Reference
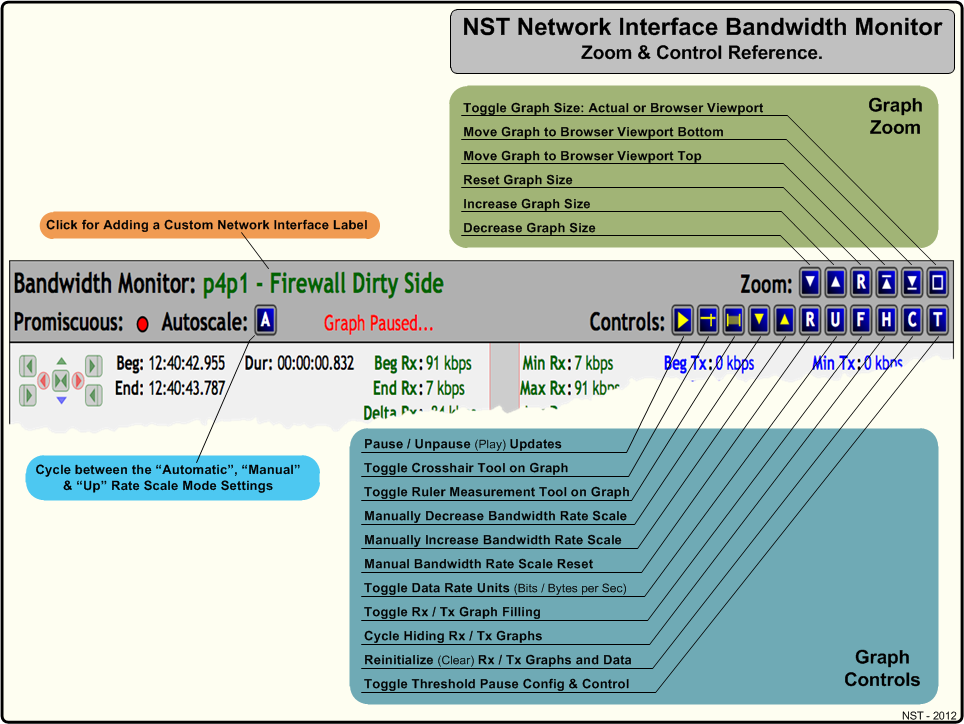
The reference diagram below provides a brief description of each Graph Zoom and Graph Control buttons available with each NST Network Interface Bandwidth Monitor Graph. NST WUI tool tips are also available for each button and notification area providing a more descriptive usage or explanation dialog.
NST Bandwidth Monitor Peak Trough Detection & Ruler Tool Resize & Movement Controls
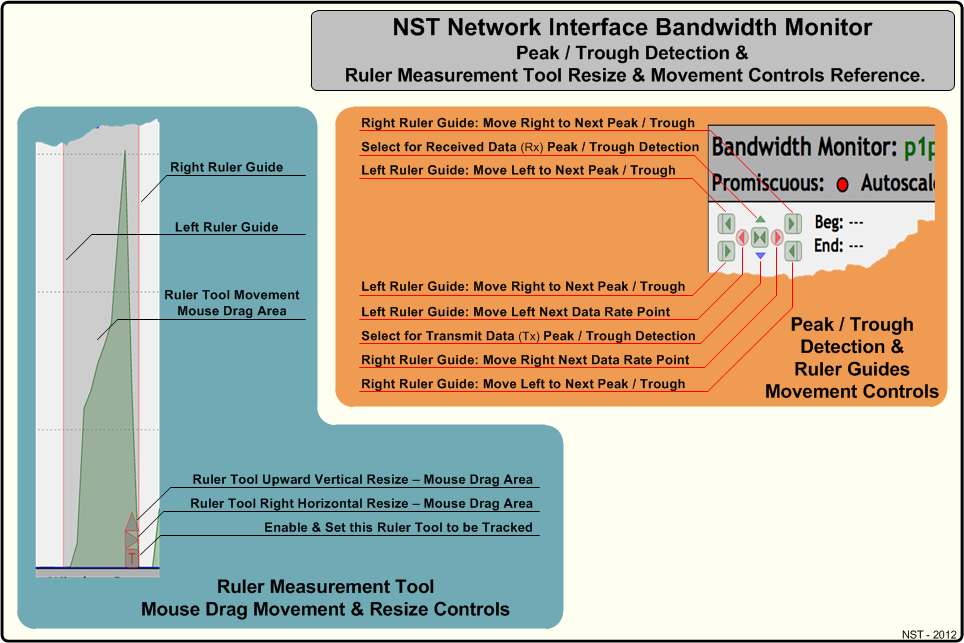
The reference diagram below provides a brief description of the Peak / Trough Detection & the Ruler Measurement Tool Resize & Movement Control buttons available with each NST Network Interface Bandwidth Monitor Graph. NST WUI tool tips are also available for each button or action providing a more descriptive usage dialog.
The Ruler Tool is handy for time and bandwidth rate analysis. One can navigate the tool by moving the mouse cursor in between the left and right ruler guides and then dragging it accordingly with your mouse device. The left and right ruler guides serve as the start and stop position for the displayed time and bandwidth rate analysis results.
NST Bandwidth Monitor Crosshairs Tool
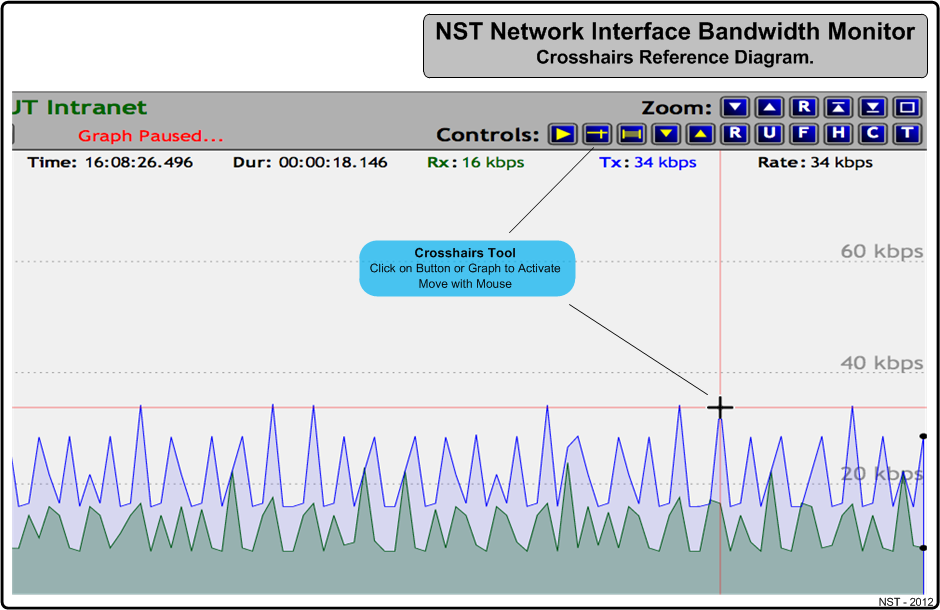
The reference diagram below provides a brief description of the Crosshairs Tool available with each NST Network Interface Bandwidth Monitor Graph. The Crosshairs Tool can be activated by clicking on either the graphing area of a Bandwidth Monitor or using the Crosshairs button.
The Crosshairs Tool displays the data acquisition time, window data duration from the right graph edge and the data bandwidth rates. The horizontal Crosshair is used to calculate the bandwidth rate for the mouse cursor position and is displayed in black in the upper right hand corner of the graph. The vertical Crosshair is used to calculate the bandwidth rate for both the Receive (Rx) and the Transmit (Tx) data and is displayed in "Green" and "Blue" respectively.
NST Bandwidth Monitor General Information
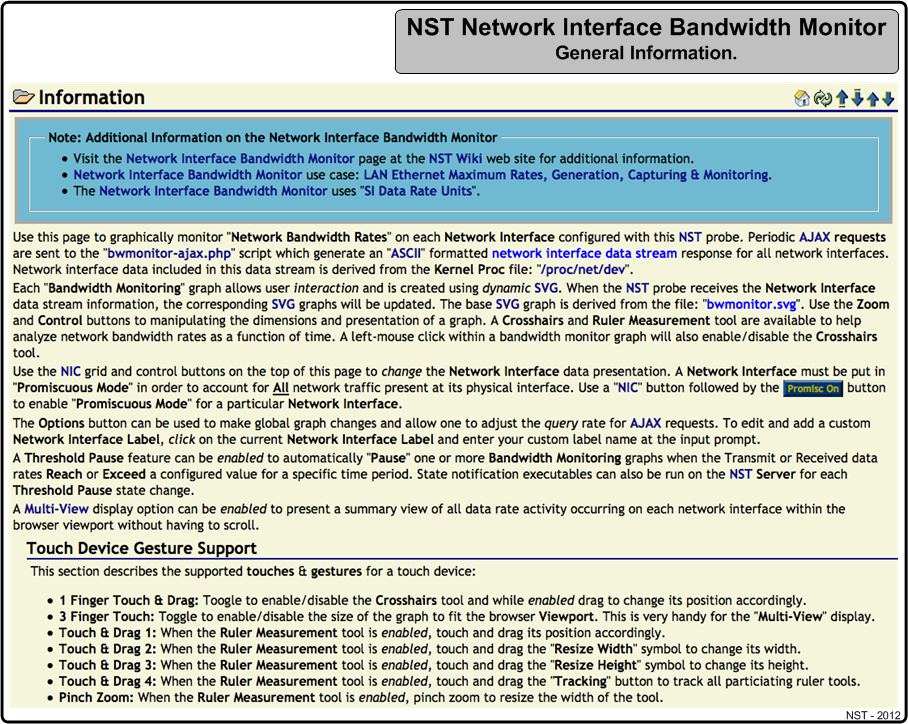
The image below was created from the NST WUI Network Interface Bandwidth Monitor Information section. Useful information on the "Theory of Operation" and "Touch Device Gesture Support" can be found.
NST Bandwidth Monitor: Multi-View
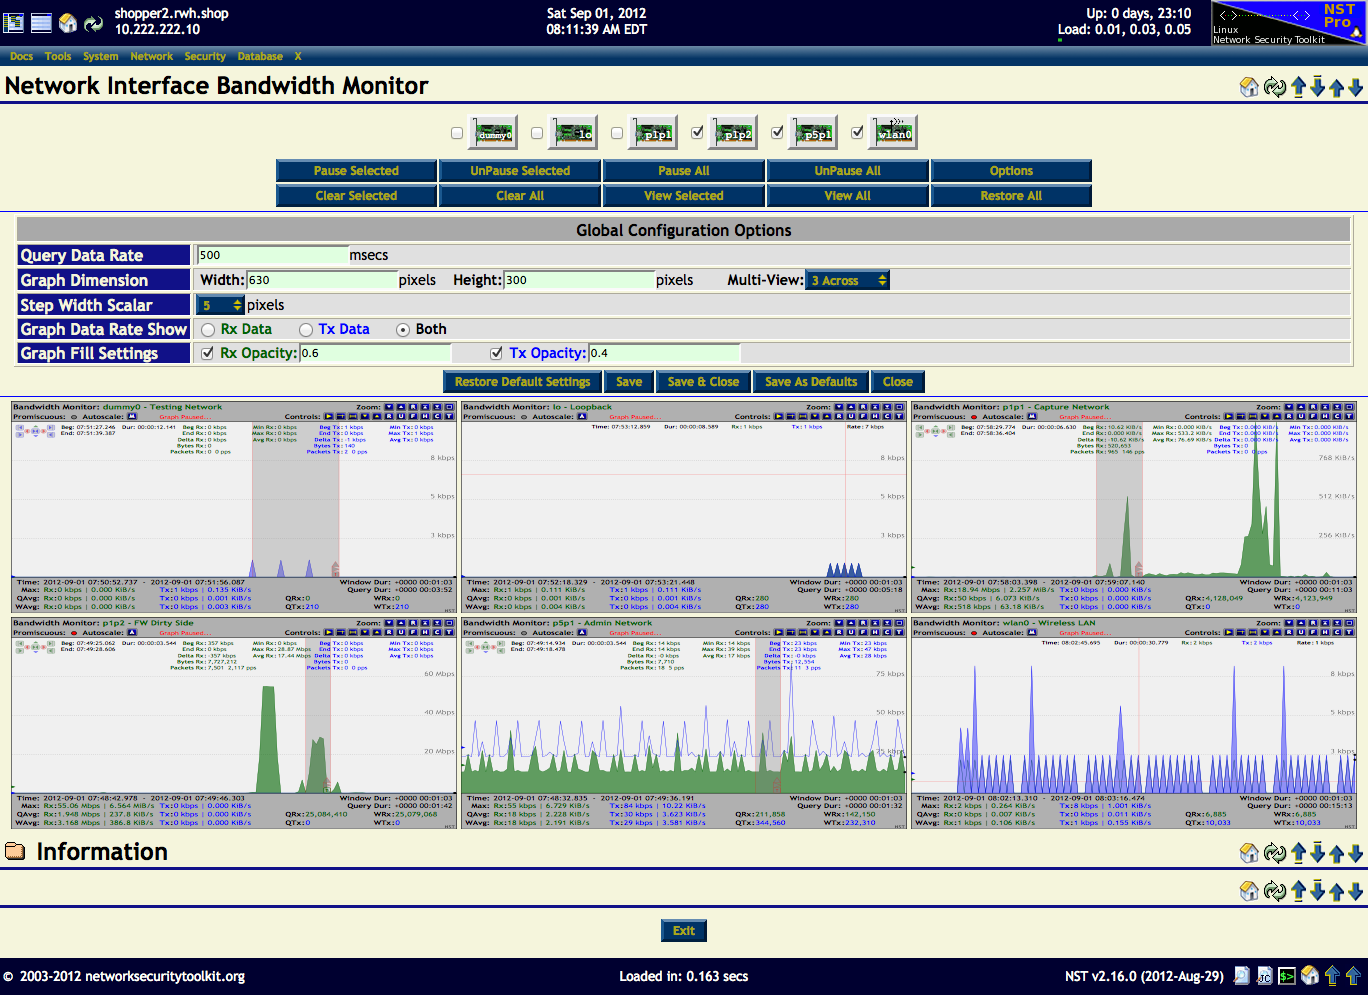
The screenshot below demonstrates the use of the "Multi-View" option for displaying multiple network interfaces in a row. In this case network interface: dummy0, lo, p1p1, p1p2, p5p1, and wlan0 are shown. The main purpose of this feature is to present a summary view of all data rate activity occurring on each network interface within the browser viewport without having to scroll. If the network activity on a graph of interest needs to be further explored, then just click on its Graph Zoom To Browser Viewport button to replace the current view with this entire bandwidth monitoring graph.
This bandwidth monitor graph presentation can be a useful viewing option for a touch device like an "iPad". One can then zoom in on a particular bandwidth monitoring graph to perform detailed analysis. A 3 Finger Touch Gesture is supported to quickly zoom in on a graph. The zoom scaling capability of each bandwidth monitoring graph is quite remarkable since it is based on SVG. The choices for the "Multi-View" option can be Disabled or a selection range from 1 up to the total number of configured network interfaces on the NST system to be displayed across in a row.
The "Global Configuration Options" panel is also shown below. This is where the "Multi-View" configuration option is located. When you select a new "Multi-View" value your change is immediately presented.
Large Multi-Network Interface Adapter Server Configuration Example
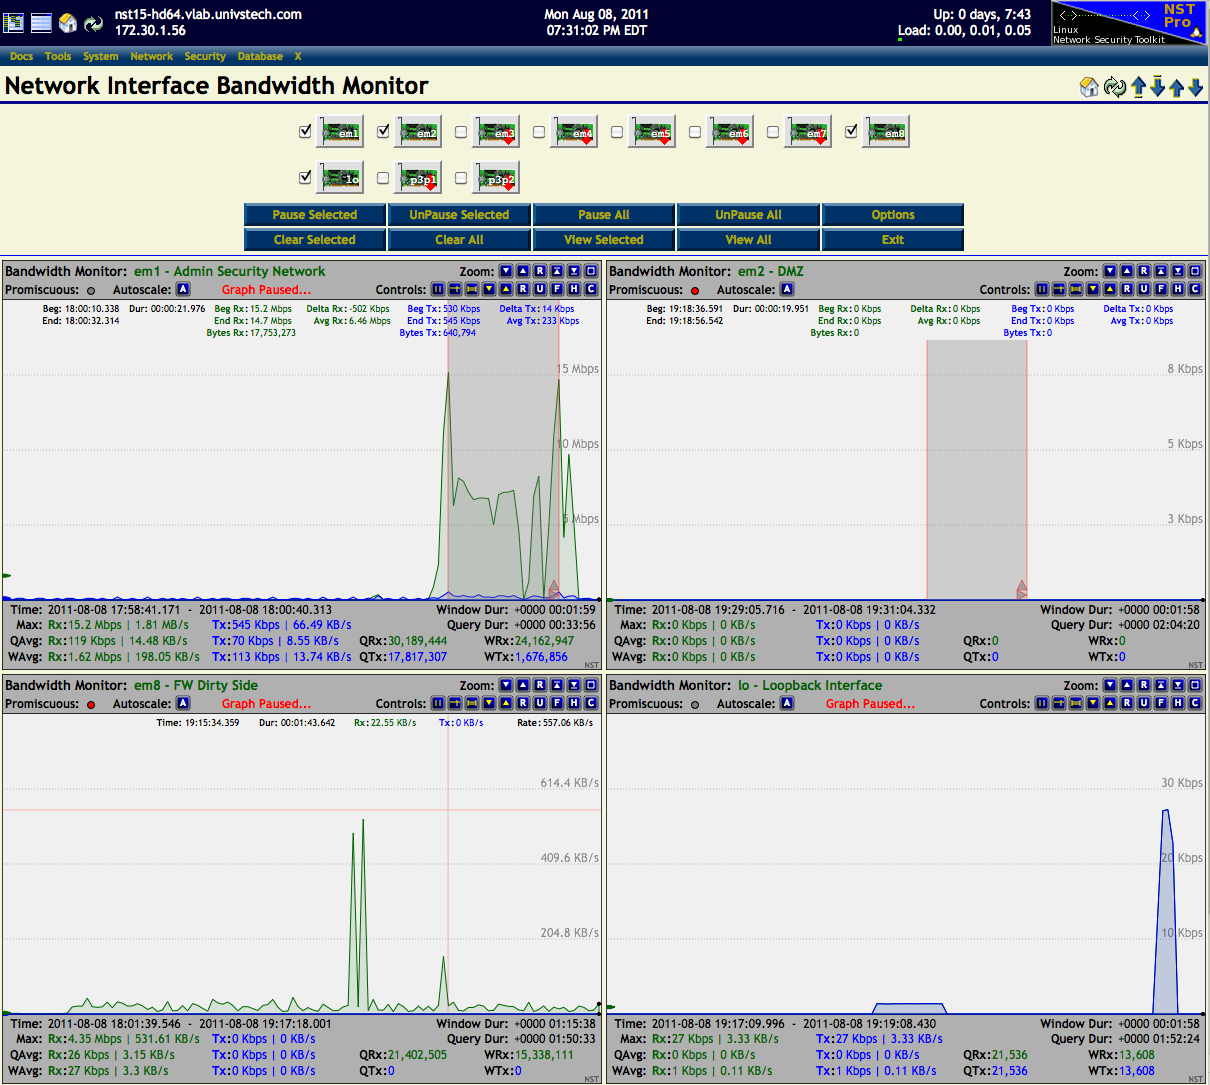
This example shows the bandwidth monitoring application for selected network interfaces: "em1, em2, em8 and lo" on a NST system configured with eleven (11) network interfaces.
Threshold Pause
The Threshold Pause feature allows one to configure an "Armed" data rate so that if this threshold value is reached or exceeded for a specified duration, one or more Bandwidth Monitoring graphs will be paused (i.e., A triggered event occurred). This feature closely mimics the armed, threshold and trigger functionality that is found in a standard digital oscilloscope. The Threshold Pause configuration popup dialog is enabled using the "T" button control. See the NST Bandwidth Monitor Reference Diagram for an example look at a Threshold Pause Configuration & Control dialog.
Each Bandwidth Monitoring graph has its own Threshold Pause Configuration & Control dialog. You can set one or simultaneous triggers to occur using the pseudo real-time "Receive" and "Transmit" bandwidth data rate values. Specify an "Armed Duration" in milliseconds to indicate how long the bandwidth data rate must sustain or exceed the "Armed" data rate value. Once this condition is satisfied, a "Trigger" event will occur and all selected "Paused NICs" will stop updating after the "Post Trigger Delay" expires. Use the "Enable" or the "Enable & Close" button to commence a Threshold Pause session.
Threshold Pause State Notification Execs
One can also enable the ability to run "Notification Executables" on the NST server side when a Threshold Pause state change occurs. This allows for a bandwidth rate trigger capability that can be quite useful. As an example, one could initiate a network packet capture when a sustained bandwidth data rate exceeds the "Armed" data rate or indicate to your IDS service that a denial-of-service (DOS) attack may be occurring.
All executables located in directory: "/etc/nst/notifications/bwmon" with file extension: ".bwmon" will be run. NST comes with two (2) example scripts for Threshold Pause state change logging and Email notification. These script are located in the notification executable directory: "/etc/nst/notifications/bwmon". Documentation on the configuration and usage can be found in each script.
Select the "Notification Execs" check box to enable Threshold Pause state change executables to be run. A configurable "Notification ID" can be set to uniquely identify Threshold Pause sessions between different browsers using the same NST system for bandwidth monitoring.
- Disabled
- Enabled
- Armed
- Triggered
- Paused
- Paused-Enabled
- Enabled-Started
- Armed-Rx-Started
- Armed-Rx-Bypassed
- Armed-Tx-Passed
- Armed-Rx-Cleared
- Armed-Tx-Cleared
- Armed-Tx-Started
- Graph-Paused
- Graph-UnPaused
- Page-Enter
- Page-Exit