Multi-Tap Network Packet Capturing
Overview
This section will demonstrate the use of Multi-Tap Network Packet Capture with NST. The NST WUI implementation supports simultaneous Packet Capture on up to 4 network interfaces (Quad Tap) per multi-tap capture session. Multi-segment network packet capture and decode analysis can be performed with the NST Multi-Tap Network Packet Capture implementation. NST uses the Wireshark network protocol analyzer suite for network packet capture and decode.
Theory Of Operation
Prior to commencing a multi-tap capture session, each enabled "Tap" interface must be associated with a registered network interface on the NST probe. Up to 4 "Tap" interfaces can be enabled. A "Tap" interface is independent of any registered network interface on the NST probe. By assigning a separate network interface to each "Tap", it is possible to perform a network capture as packets flow across a networking device (e.g., router or firewall). One can also associate the same network interface to multiple "Tap" interfaces. This allows one to apply a different "Capture Filter" for the same network interface during packet capture.
A "Capture Data Directory" must also be selected for the resultant merged multi-tap capture file, log file and if chosen, the individual tap member capture files. One should consider using a "RAM-based" file system for packet storage while capturing data packets on high traffic network segments. The Linux "RAMFS" or "TMPFS" file systems make excellent choices. The NST WUI provides convenient access for the creation of either one of these file systems during multi-tap capture setup.
The Wireshark light-weight network packet capture tool: "dumpcap" is used as the capture engine. Each enabled "Tap" interface will run a separate "dumpcap" process when the multi-tap capture session is started. Each "dumpcap" process can be configured to have a separate "Capture Filter" and other associated options.
A "Multi-Tap Merge Manager" process is also started when the multi-tap capture session is commenced. The "Multi-Tap Merge Manager" is responsible for governing each separate "dumpcap" process during the course of the multi-tap capture session. If any multi-tap member "dumpcap" process terminates, the "Multi-Tap Merge Manager" will terminate all other "dumpcap" processes associated with the multi-tap capture session. Once all "dumpcap" processes have been terminated, all "Tap" member capture files will be merged using the Wireshark "mergecap" utility.
Capture Taps
When capturing packets at Gigabit Ethernet rates and one needs total visibility on the link, then a passive tap is required. Net Optics, a global leader in passive monitoring, makes an excellent 10/100/1000BaseT Tap (TP-CU3) for passively allowing access to monitor GigaBit traffic.
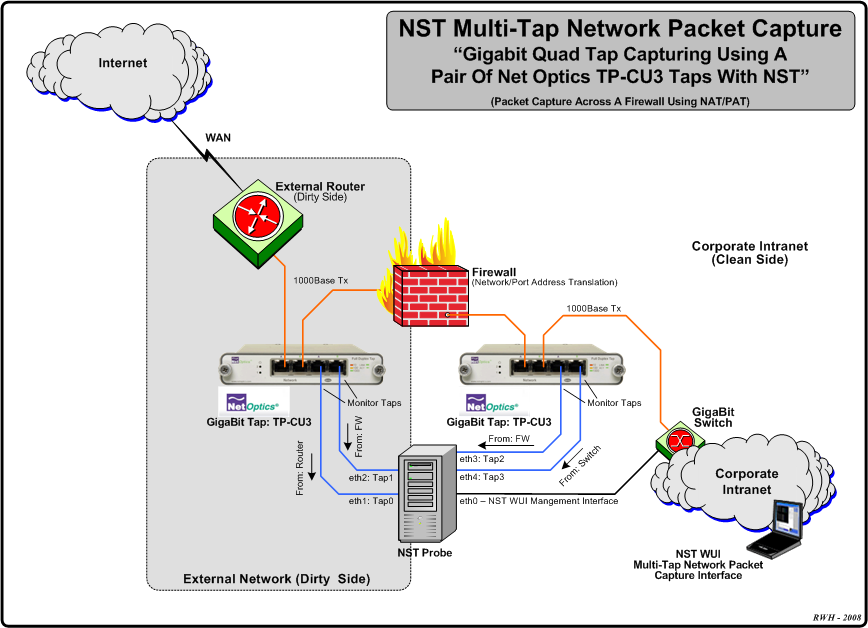
Configuration 1: Multi-Tap Network Packet Capture Across A Firewall - NAT/PAT Traffic
The diagram depicted below shows an example Multi-Tap Capture Setup for monitoring GigaBit traffic across a firewall boundary. One may need to explore the capturing of packets as they transverse the firewall and undergo both Network and Port Address Translation (NAT/PAT).
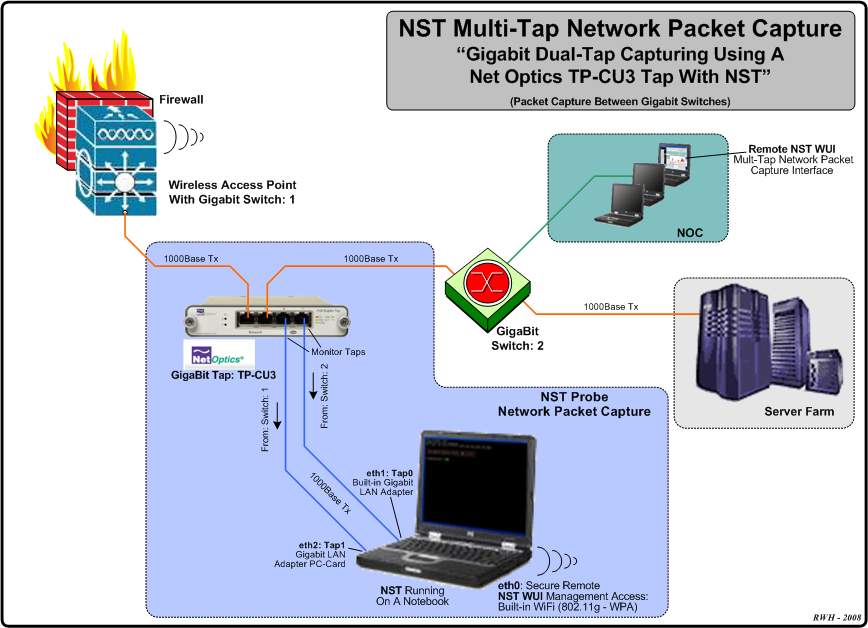
Configuration 2: Multi-Tap Network Packet Capture - Traffic Between Gigabit Switches
The diagram displayed below shows an example Dual-Tap Capture Setup for monitoring network traffic between 2 Gigabit switches. In this case a generic notebook computer was used and configured with 3 network interfaces (A built-in Gigabit LAN adapter, a Gigabit LAN adapter PC-Card and a built-in 802.11g/n wireless adapter for secure remote access and control of NST).
Example 1: Multi-Tap Network Packet Capture Session Step-By-Step
This section will demonstrate a Multi-Tap Network Packet Capture session using 2 network adapters (eth1 and eth2) as the target capture interfaces. We will concentrate on email traffic (POP and SMTP) occurring on network: "172.28.8.0/24". It is assumed that the NST probe has sufficient network interface adapters (at least 2 in this case) to perform this capture and that these interfaces are attached to a network tap similar to what is shown in the diagrams above or some type of port mirroring (e.g., SPAN - Switched Port Analyzer) configuration.
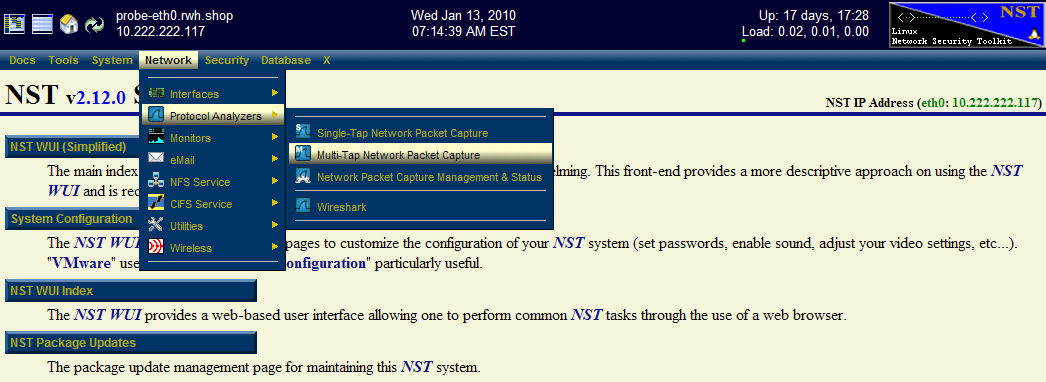
Step: 1 NST WUI Multi-Tap Network Packet Capture Page
From the NST WUI Start page go to the NST WUI Multi-Tap Network Packet Capture page. This is accomplished by using the NST WUI Menu. Go to "Networking" then "Protocol Analyzers" and then go to the "Multi-Tap Network Packet Capture" page as shown below.
Step: 2 Multi-Tap Interfaces & Data Directory Selection
Use the navigational aid link: [Select Tap Interfaces/Directory] to go to the "Multi-Tap Interfaces & Data Directory Selection" section. This is where you select the target capture interfaces and data directory on the NST probe when you will store your multi-tap capture.
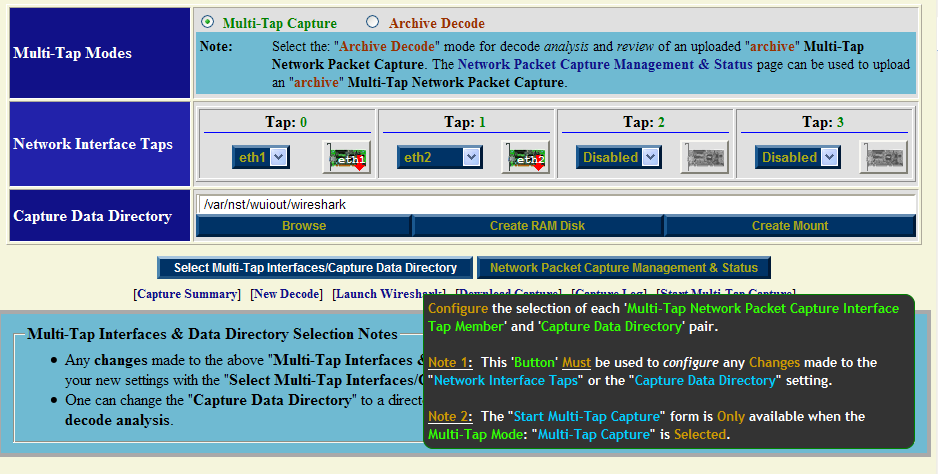
Select interface: "eth1" for Tap0 and select interface: "eth2" for Tap1. For now use the default capture data directory: "/var/nst/wuiout/wireshark". Your configuration should look similar to the NST WUI image caption above. Next select the "Select Multi-Tap Interfaces/Capture Data Directory" button to make your configuration known to NST.
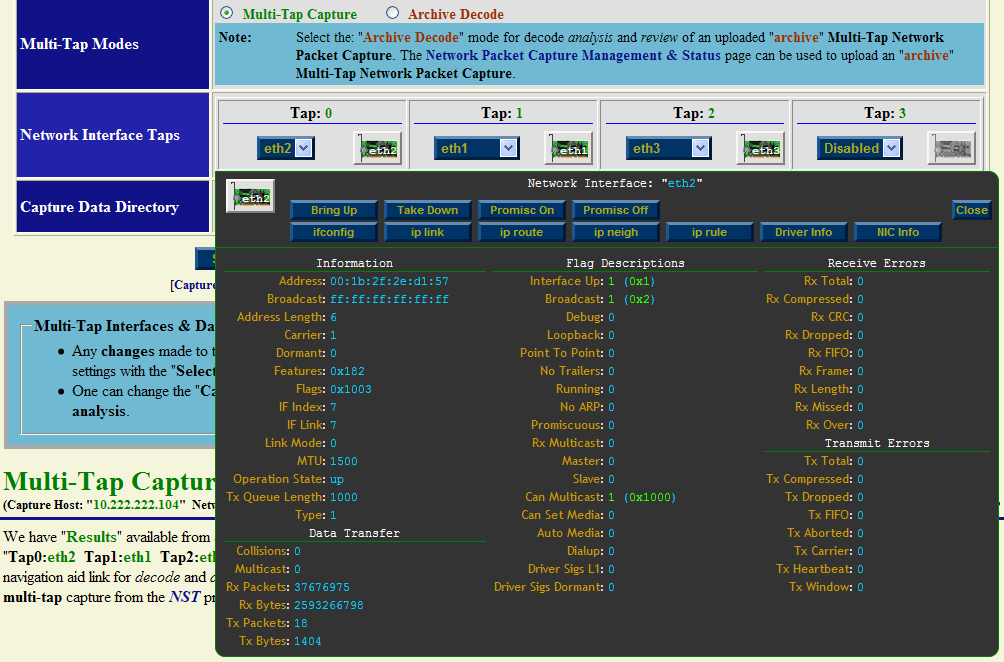
One can also click on a "NIC Adapter" icon to view and control a specific network interface adapter. The caption below shows information for NIC Adapter: "eth2" and results from running the "ethtool eth2" command. Even though the interface state is: "Down", a link has been established and detected on this interface. This is valuable information to know prior to capturing on a particular network interface.
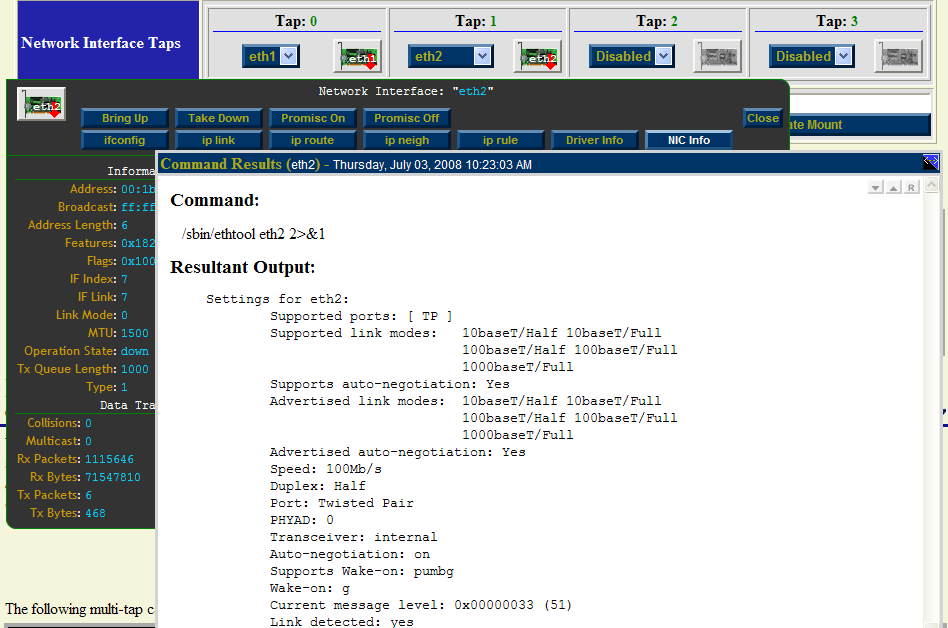
Both interfaces are initially shown in the "Down" state indicated by the red down arrow superimposed on the "NIC Adapter" icons. The network interface will automatically be put in the "Up" state prior to starting a capture session.
Step: 3 Start Multi-Tap Capture Form
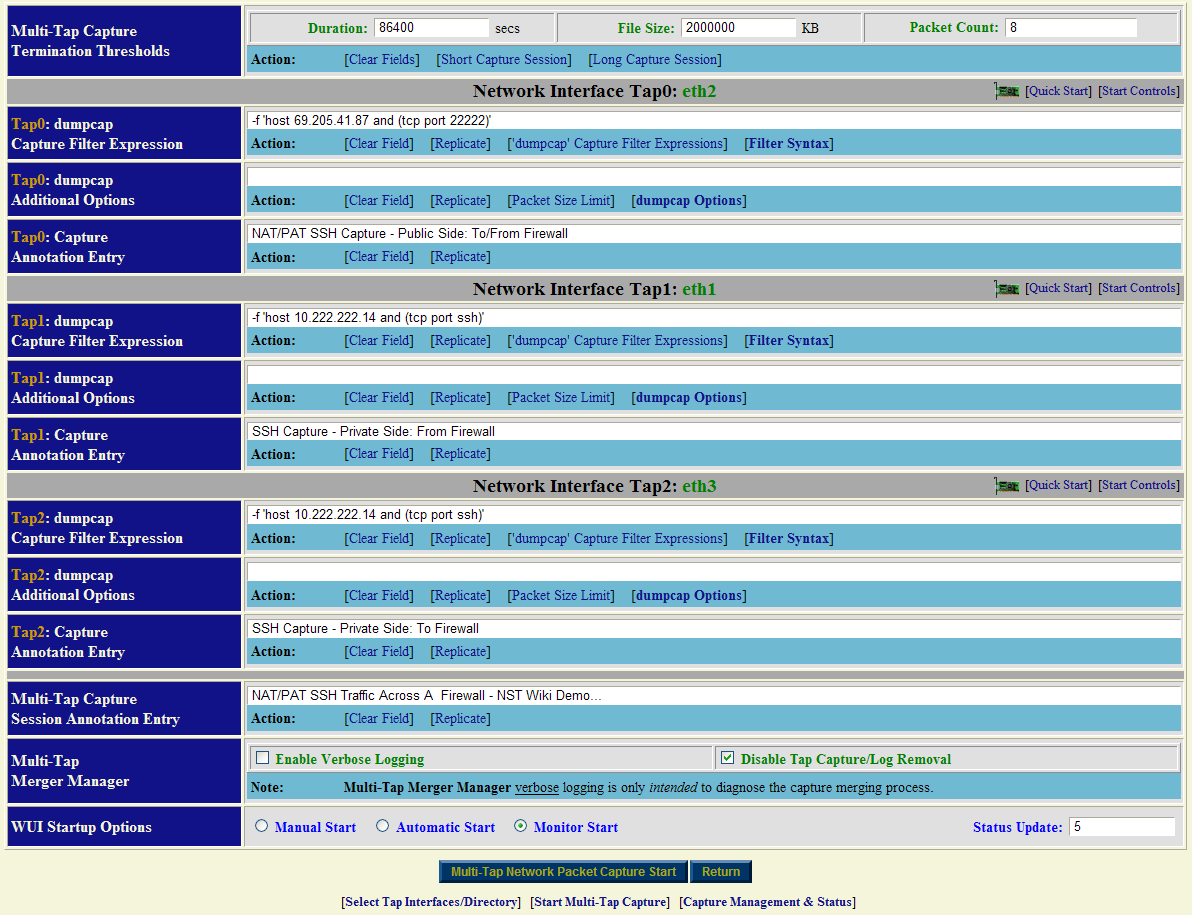
After you have selected your "Tap Interfaces" and "Capture Data Directory" next go to the "Start Multi-Tap Capture" section. For this demonstration we will use a "dumpcap" capture filter expression for "POP" and "SMTP" traffic on network: "172.28.8.0/24". Since we selected to use only 2 Taps (Tap0 and Tap1), then only 2 Taps will be dynamically available for configuration out of a possible 4 Taps in the "Start Multi-Tap Capture" form as shown below.
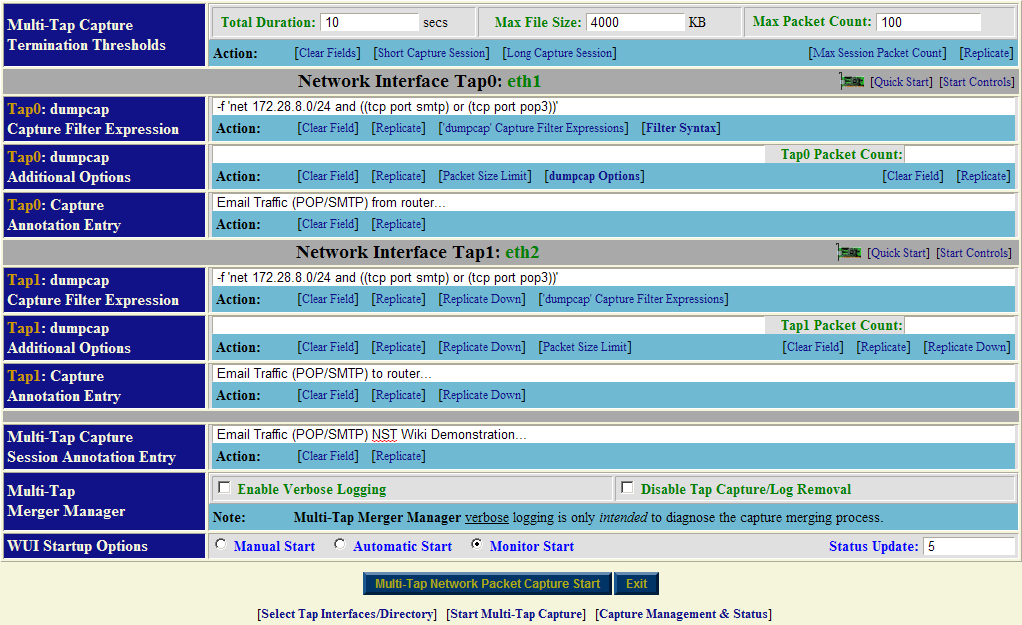
Fill in the form similar to what is shown above. Optionally use the ['dumpcap' Capture Filter Expressions] navigation aid link to help fill in the "dumpcap" capture filter expression field for each Tap. Each Tap can have a unique "dumpcap" capture filter expression. Use: "Monitor Start" as one of the "WUI Startup Options". Adjust your capture termination thresholds accordingly. In this case, the capture will terminate automatically when either of the following thresholds have been exceeded: a "10 seconds" capture time has elapsed, a file size of: "4MB" has been reached or "100" network packets have been collected.
Step: 4 Multi-Tap Network Packet Capture Start
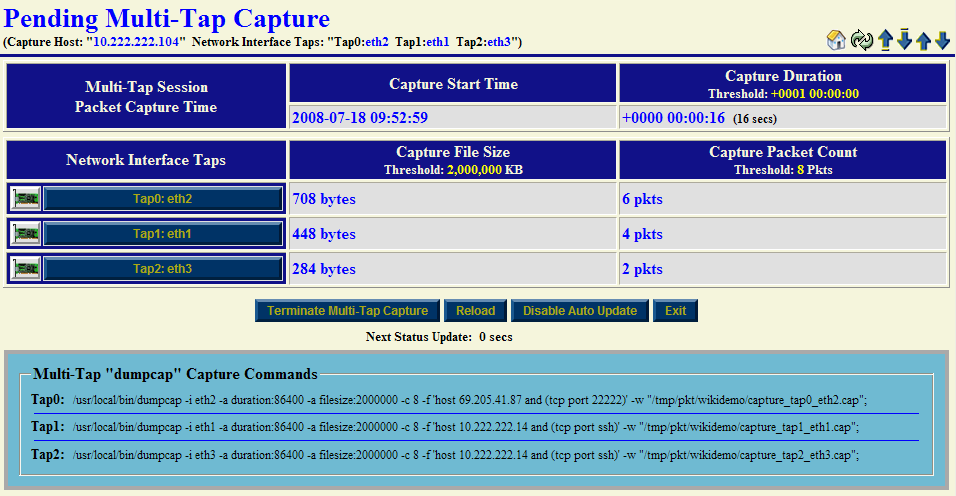
Once you are satisfied with values in the "Start Multi-Tap Network Packet Capture" form we will now commence a "Multi-Tap Network Packet Capture" session. Click on the "Multi-Tap Network Packet Capture Start" button to begin the capture session. An automatic sequence of NST WUI Multi-Tap Network Packet Capture pages will now appear until the "Pending Multi-Tap Capture" page that is shown below is reached.

Near real-time dynamic updates using AJAX will occur until one of the termination thresholds is reached. Once termination has been reached, another automatic sequence of NST WUI Multi-Tap Network Packet Capture pages will now appear until the "Multi-Tap Capture Summary" section is now displayed as show below:
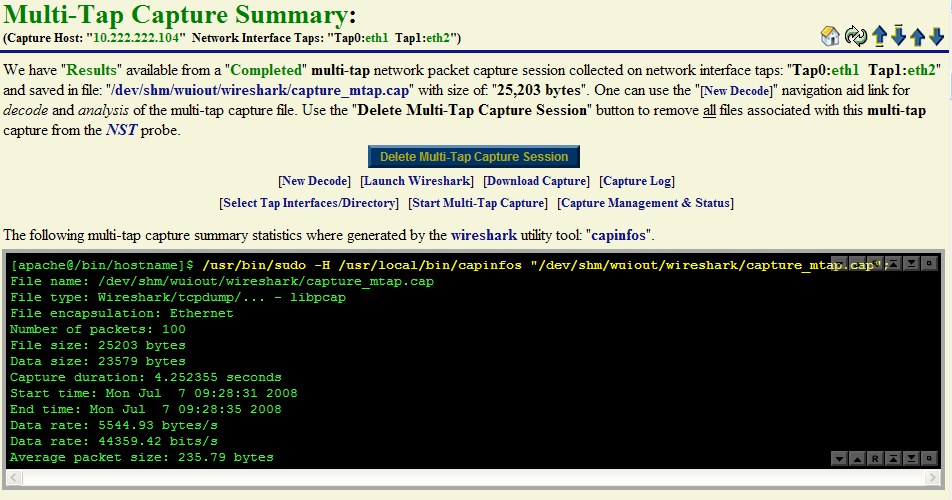
One can see from the "capinfos" summary output that the packet count termination threshold of: "100 Packets" caused the capture session to end.
Step: 5 Multi-Tap Network Packet Capture Decode Analysis
At this point we are now ready to perform a decode of the packet capture. Use the [New Decode] navigation aid link to go to the "Multi-Tap Text-Based Protocol Analyzer Decode" section.
Example 2: Multi-Tap Network Packet Capture Across A Firewall Boundary - NAT/PAT Traffic
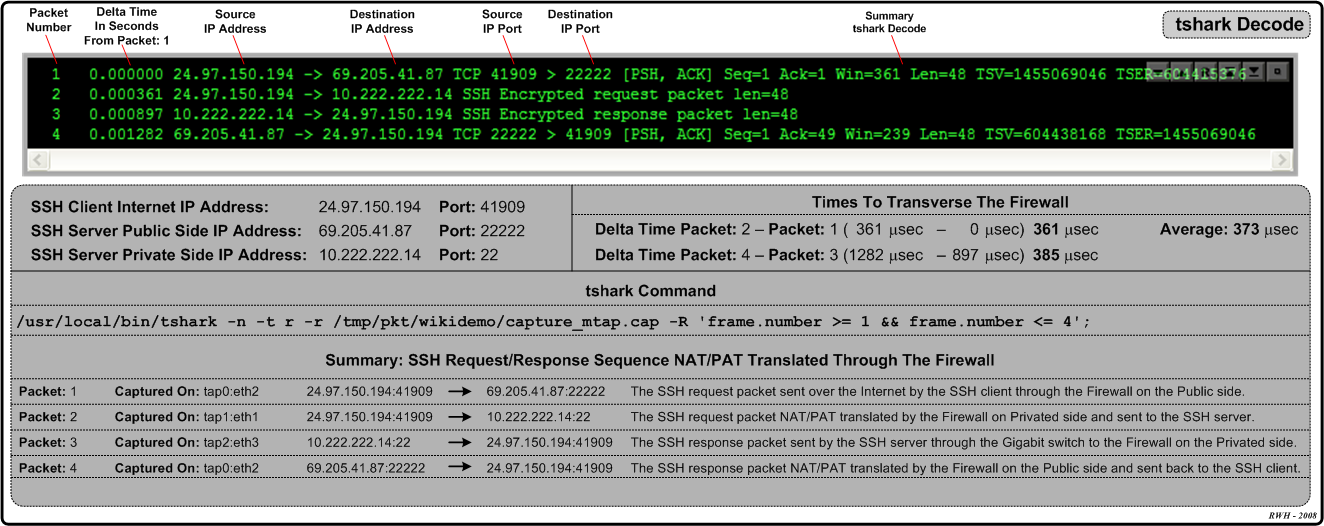
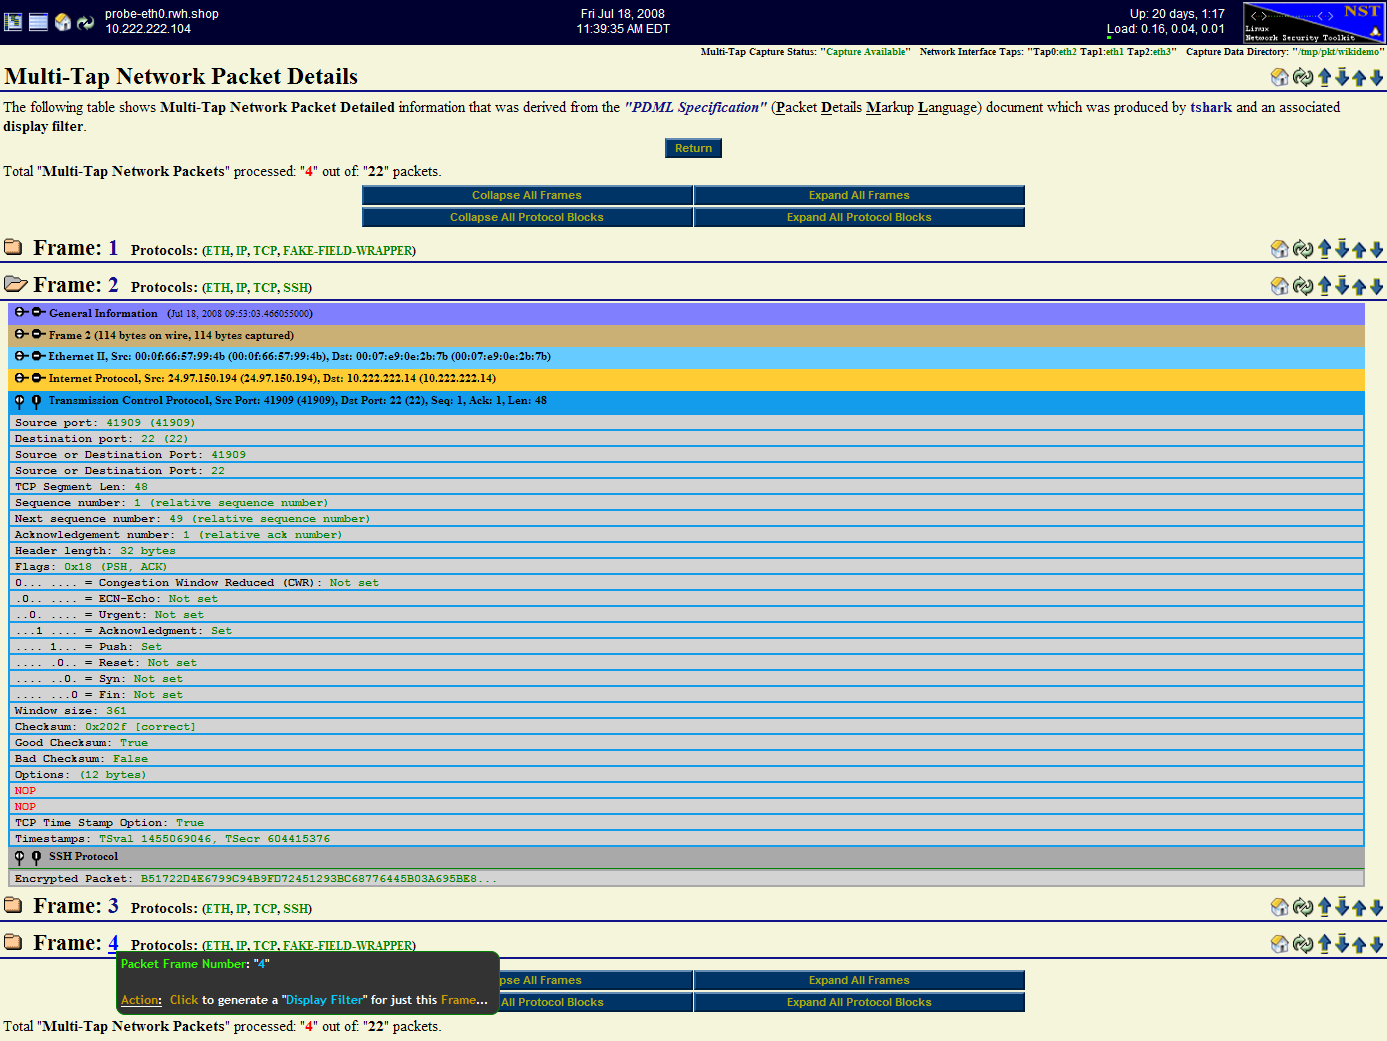
This example will explore network packet traffic as it flows across a firewall device. We will use a remote "SSH" client request for this demonstration and explore the NAT/PAT translation that occurs by decoding the capture. The following diagram shows the network environment for this multi-tap capture. The "SSH" client is located remotely on the Internet using IP Address: 24.97.150.194 and the "SSH" server is NAT/PAT translated using IP Address: 69.205.41.87:22222 its real internal IP Address is: 10.222.222.14:22.
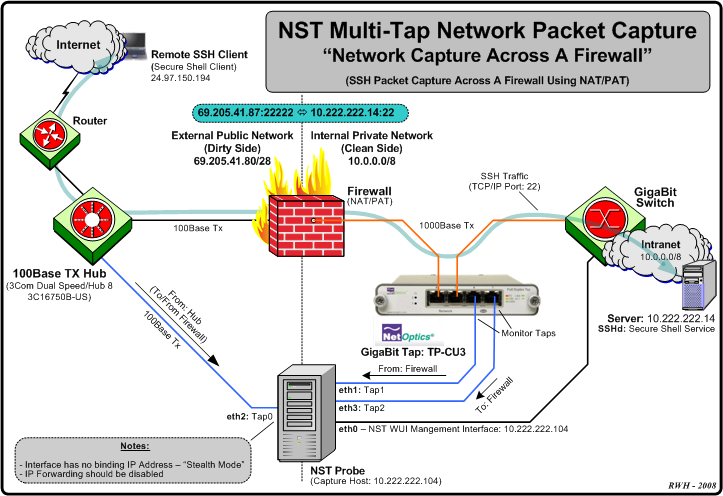
We will be using 3 tap interfaces (Tap0 - 2) for this multi-tap capture. The Hub works in "Half-Duplex" mode and presents both the Transmit and Receive network traffic from the "Dirty" (unfiltered) side of the Firewall device to: "Tap0: eth2". Taps "1" and "2" will be connected to a Net Optics Gigabit copper tap: TP-CU3 for capturing network traffic between the Firewall device and the Gigabit Switch.
Multi-Tap Interfaces & Data Directory Selection Form: NAT/PAT SSH Traffic

Multi-Tap Network Interface Information (eth2): NAT/PAT SSH Traffic
Multi-Tap Start Capture Form: NAT/PAT SSH Traffic
Multi-Tap Pending Capture: NAT/PAT SSH Traffic
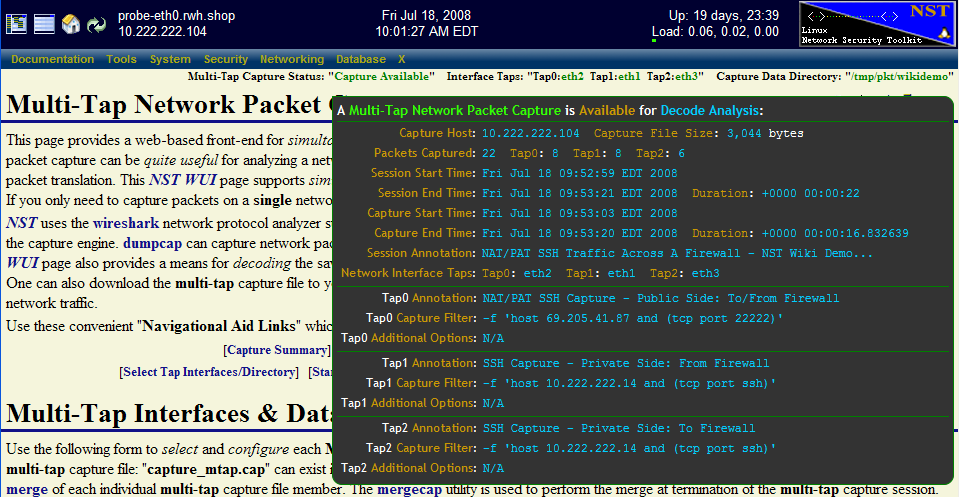
Multi-Tap Capture ToolTip Summary: NAT/PAT SSH Traffic
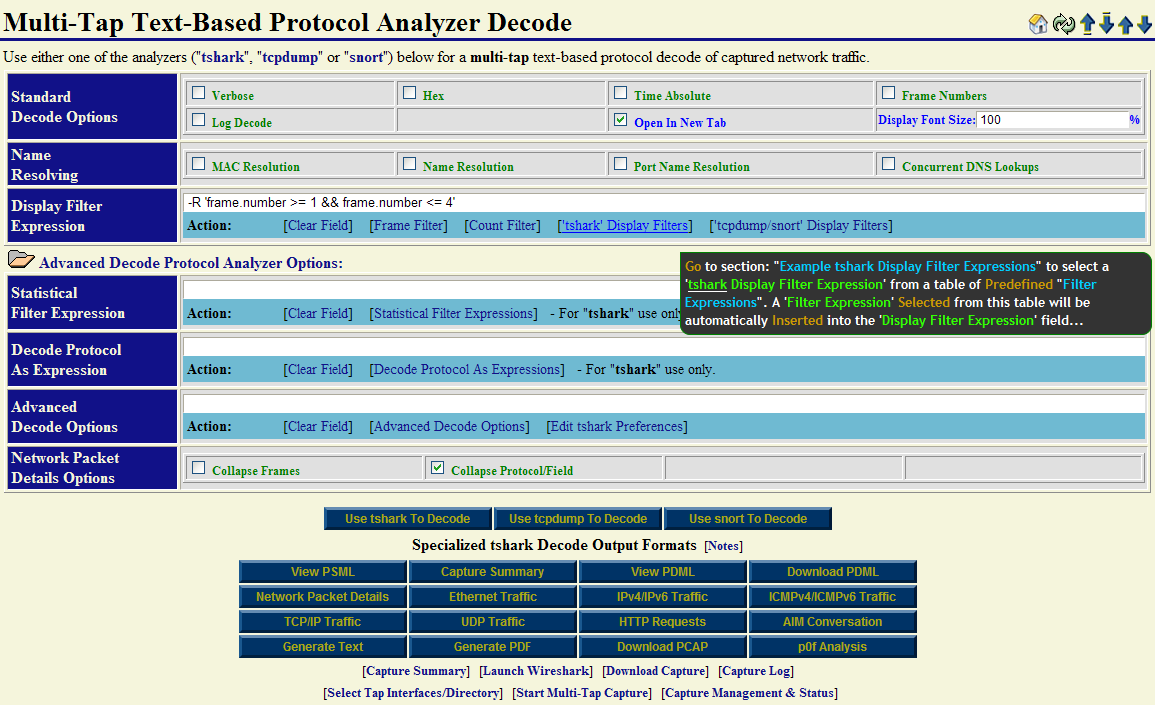
Multi-Tap Capture Decode Form: NAT/PAT SSH Traffic
Multi-Tap Capture Decode Summary: NAT/PAT SSH Traffic
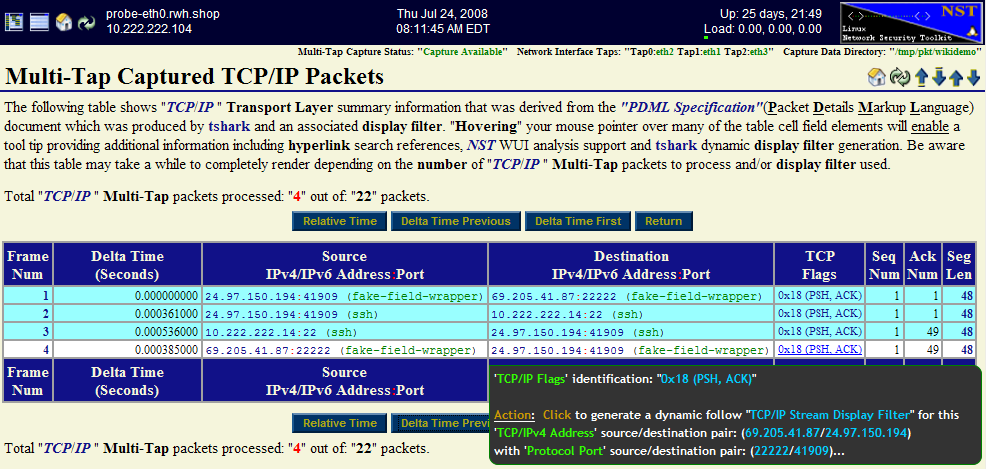
Multi-Tap Capture PDML TCP/IP Decode: NAT/PAT SSH Traffic
Multi-Tap Capture PDML Network Packet Details Decode: NAT/PAT SSH Traffic
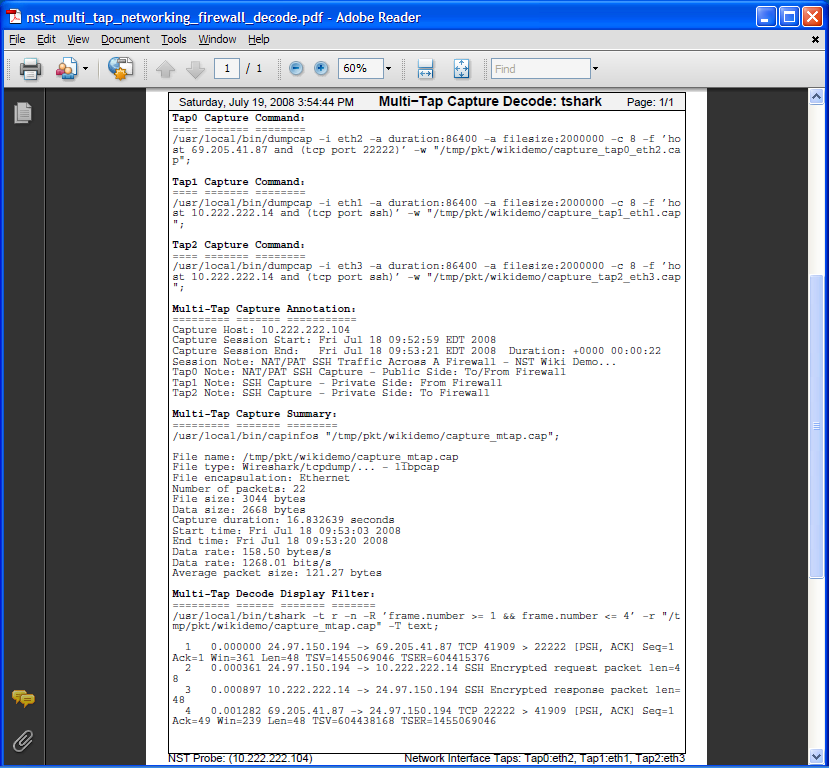
Multi-Tap Capture PDF Decode: NAT/PAT SSH Traffic
