NST Network Interface Bandwidth Monitor 2: Difference between revisions
| Line 34: | Line 34: | ||
Use this section as a reference for location and description of all controls available with the '''NST Network Interface Bandwidth 2 Monitors.''' The image below can serve as a general reference diagram for a single Bandwidth Monitor. Many of the Bandwidth Monitor features have been identified and marked on the image. A Threshold Pause feature that allows "'''Pausing'''" of one or more Bandwidth Monitoring graphs when a configured Threshold Armed Rate value is Reached or Exceeded (i.e., Triggered) is also shown. Custom executables can also be run each time a '''Threshold Pause''' state change occurs. As an example, one could initiate a network packet capture when a sustained bandwidth data rate exceeds a certain level. | Use this section as a reference for location and description of all controls available with the '''NST Network Interface Bandwidth 2 Monitors.''' The image below can serve as a general reference diagram for a single Bandwidth Monitor. Many of the Bandwidth Monitor features have been identified and marked on the image. A Threshold Pause feature that allows "'''Pausing'''" of one or more Bandwidth Monitoring graphs when a configured Threshold Armed Rate value is Reached or Exceeded (i.e., Triggered) is also shown. Custom executables can also be run each time a '''Threshold Pause''' state change occurs. As an example, one could initiate a network packet capture when a sustained bandwidth data rate exceeds a certain level. | ||
The reference diagram below depicts a '''Threshold Pause''' session that was configured on the "'''p1p1 Bandwidth Monitoring'''" graph with an Armed Rx bandwidth data rate of: "'''54.3 Mbps'''". This bandwidth rate was maintained for the Armed duration of "'''2000 msecs'''" as a condition for the Threshold Trigger to occur. A Threshold Trigger event did occur on '''2013-11-19 08:35:15.761''' at an Rx data rate value of: "''82.81 Mbps'''". A Post Trigger Delay of "'''3 seconds'''" was in effect. | The reference diagram below depicts a '''Threshold Pause''' session that was configured on the "'''p1p1 Bandwidth Monitoring'''" graph with an Armed Rx bandwidth data rate of: "'''54.3 Mbps'''". This bandwidth rate was maintained for the Armed duration of "'''2000 msecs'''" as a condition for the Threshold Trigger to occur. A Threshold Trigger event did occur on '''2013-11-19 08:35:15.761''' at an Rx data rate value of: "''82.81 Mbps'''". A Post Trigger Delay of "'''3 seconds'''" was in effect. No additional bandwidth monitoring graphs were set to be '''Paused'''. A query rate of "'''200 msec'''" was also configured for bandwidth monitor graph updates. | ||
All notification executables located in directory: "'''/etc/nst/notifications/bwmon'''" were run at each '''Threshold Pause''' state change and marked with ID: "'''PXN-1827'''". | All notification executables located in directory: "'''/etc/nst/notifications/bwmon'''" were run at each '''Threshold Pause''' state change and marked with ID: "'''PXN-1827'''". | ||
Revision as of 15:31, 19 November 2013
Overview
The NST Network Interface Bandwidth Monitor 2 is a second generation interactive dynamic SVG/AJAX enabled application integrated into the NST WUI for monitoring Network Bandwidth usage on each configured network interface in pseudo real-time.
A use case for the Bandwidth Monitor can be found in the Wiki article: "LAN Ethernet Maximum RAtes, Generation, Capturing & Monitoring".

SVN: 5413
See page: NST Network Interface Bandwidth Monitor for additional information until this page is completed.
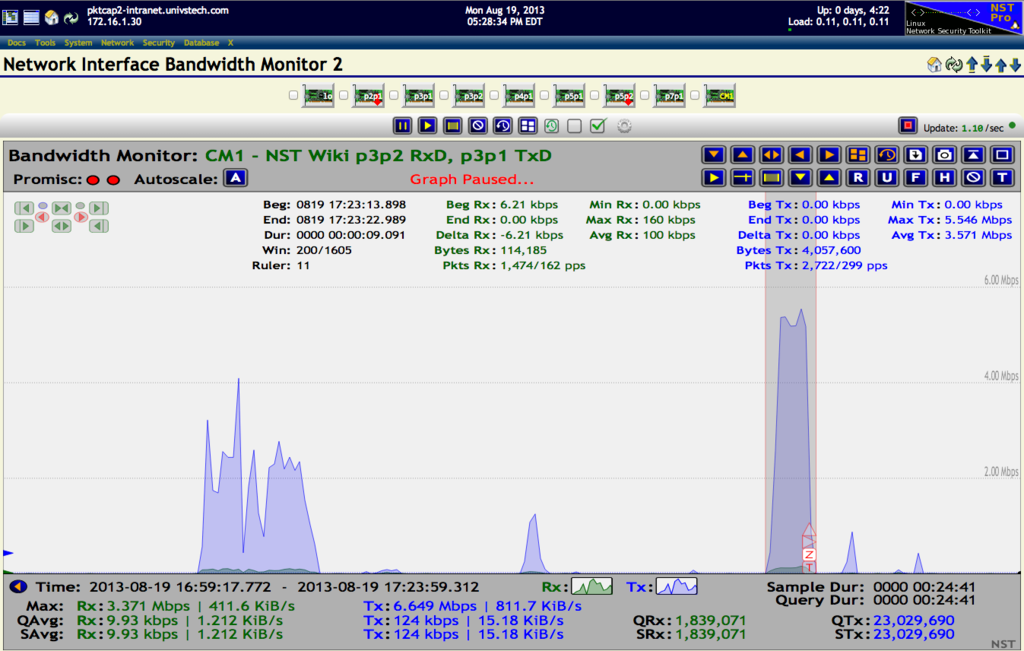
The following Bandwidth Monitor displays network traffic to and from the NST Wiki site. A TP-CU3 Tap is inserted between the NST probe and the NST Wiki site providing full-duplex traffic access. A Custom Monitor was created to display interface traffic on the Tap's two (2) monitoring ports: p3p2 - RxD and p3p1 - TxD. The Ruler Measurement Tool is also enabled and focused on a typical HTTP web page transaction sequence.

NST Bandwidth Monitor 2 Reference Diagram
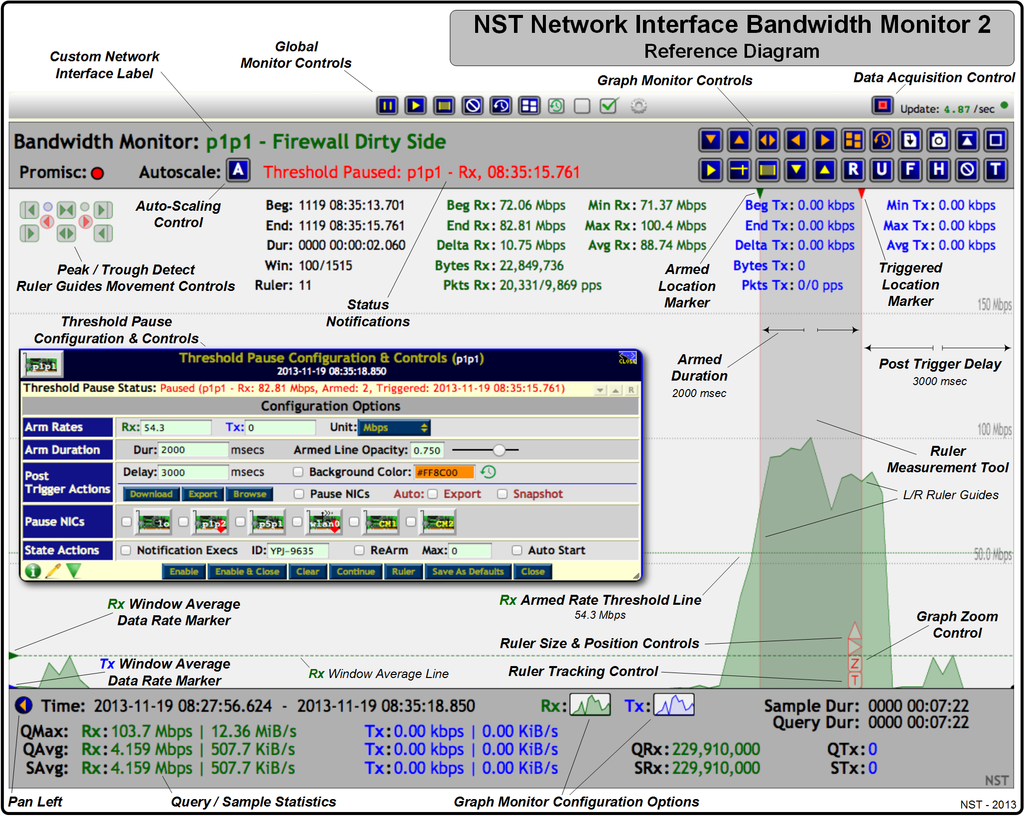
Use this section as a reference for location and description of all controls available with the NST Network Interface Bandwidth 2 Monitors. The image below can serve as a general reference diagram for a single Bandwidth Monitor. Many of the Bandwidth Monitor features have been identified and marked on the image. A Threshold Pause feature that allows "Pausing" of one or more Bandwidth Monitoring graphs when a configured Threshold Armed Rate value is Reached or Exceeded (i.e., Triggered) is also shown. Custom executables can also be run each time a Threshold Pause state change occurs. As an example, one could initiate a network packet capture when a sustained bandwidth data rate exceeds a certain level.
The reference diagram below depicts a Threshold Pause session that was configured on the "'p1p1 Bandwidth Monitoring" graph with an Armed Rx bandwidth data rate of: "54.3 Mbps". This bandwidth rate was maintained for the Armed duration of "2000 msecs" as a condition for the Threshold Trigger to occur. A Threshold Trigger event did occur on 2013-11-19 08:35:15.761 at an Rx data rate value of: "82.81 Mbps". A Post Trigger Delay of "3 seconds" was in effect. No additional bandwidth monitoring graphs were set to be Paused. A query rate of "200 msec" was also configured for bandwidth monitor graph updates.
All notification executables located in directory: "/etc/nst/notifications/bwmon" were run at each Threshold Pause state change and marked with ID: "PXN-1827".
The traffic generated for this example was from a YUM update. A Dualcomm DGCS-2005L TAP was used on the external side of a firewall and presented the network traffic to interface: "p4p1".
